 fdab957b55
- Move uploaded renders into docs/images/ (tracked).
- Insert the Monitor Dash render at the top of README.md as the
  headline image of the project.
- Rewrite README body to point at the forgejo wiki (six pages now
  live) as the canonical documentation surface, with PLAN.md
  staying as working notes.
- Gitignore docs/wiki/ so the wiki git checkout does not bleed
  into the main repo.

Refs #1

Co-Authored-By: Claude Opus 4.7 (1M context) <noreply@anthropic.com>
1.5 KiB
claude-gauge
Hardware instrument cluster displaying Claude Code session telemetry in real time.
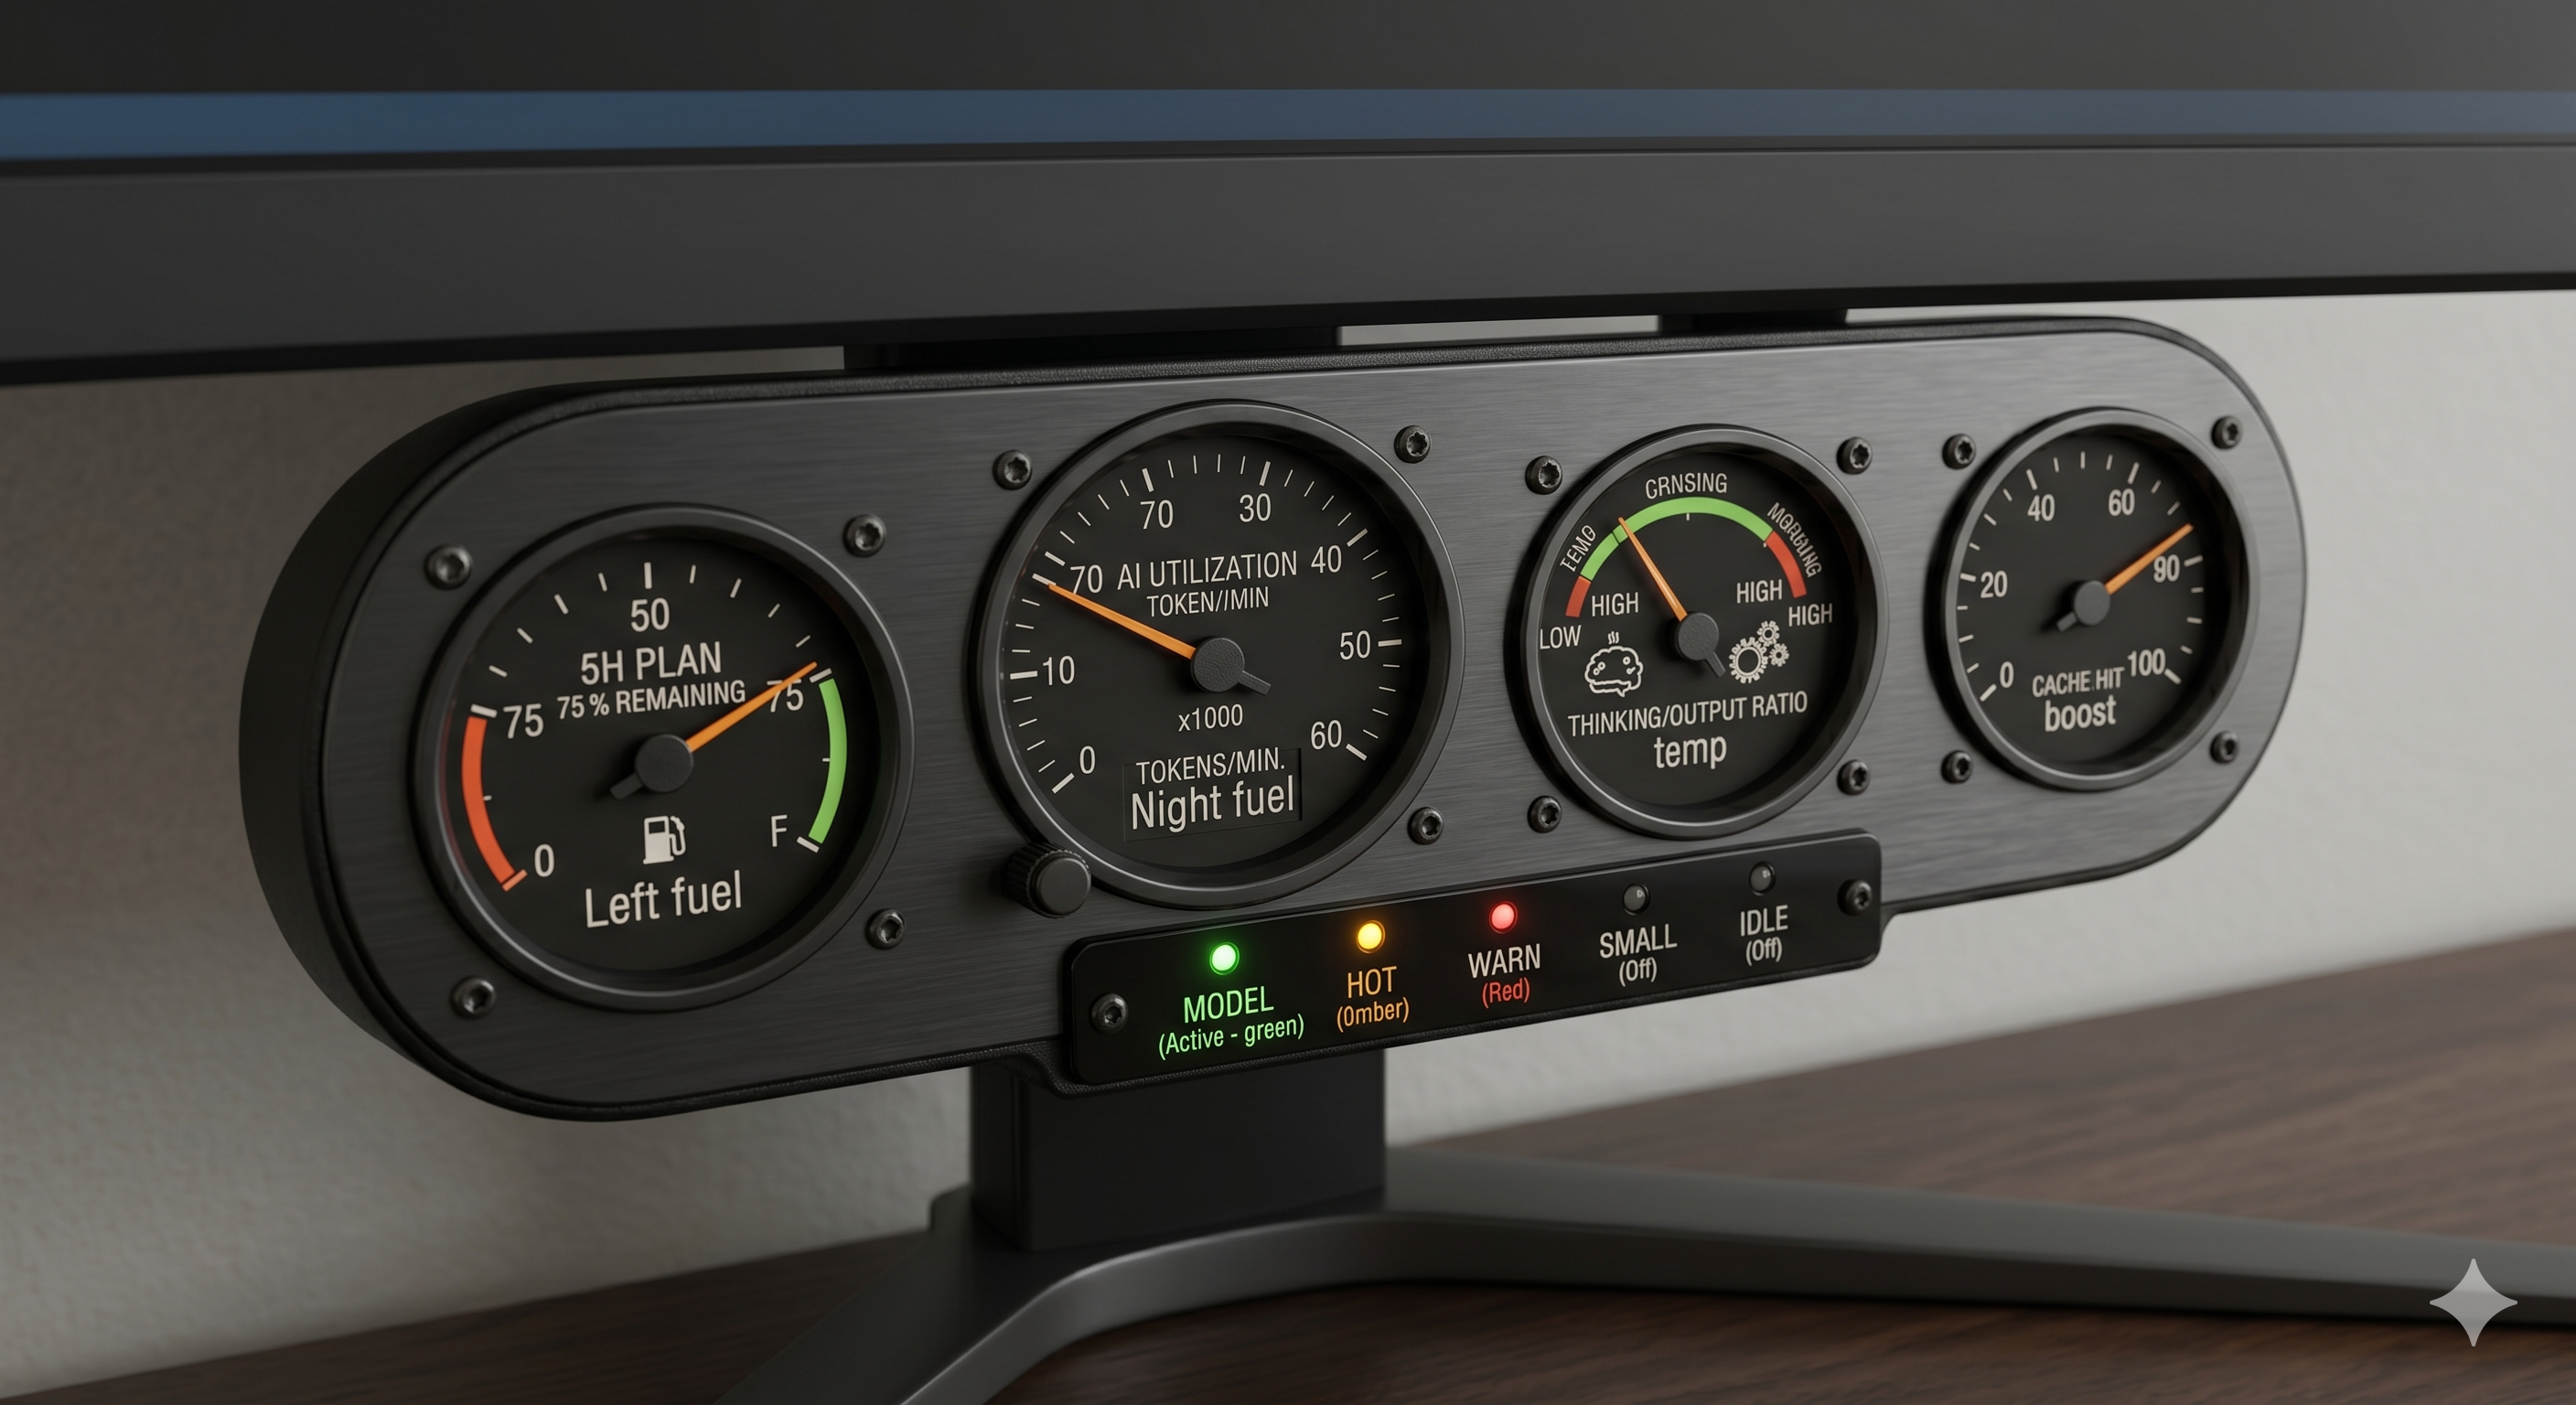
Four analog needle gauges (5h fuel, tokens/min tach, thinking ratio,
cache hit) plus an annunciator row of model-indicator and warning
lamps, driven by an ESP32 polling a local Python daemon. The daemon
reads either Claude Code's native OpenTelemetry feed through a
Prometheus stack (architecture A) or ccusage CLI aggregates with a
direct JSONL tail for the tach (architecture B). Firmware and
cluster are identical across both.
Fighter-jet / race-car aesthetic. Physical-first: the deep stats
live in Grafana (A) or ccusage (B); the dial on the desk is the
ambient summary.
Documentation
Full documentation is in the wiki:
- Home — overview and cluster at a glance
- Architecture — two-architecture tradeoff, daemon contract
- DataSources — Docker Compose + PromQL (A),
ccusage+ watchdog (B) - Hardware — X27.168 steppers, ESP32 wiring, firmware, enclosure
- Roadmap — phases, shipped, deferred
- Ideas — exotic enclosure variants, metrics brainstorm, parked thoughts
Working notes live in PLAN.md. Session records and in-flight thinking happen there; the wiki is the curated surface.
Status
Scaffolded. Phase A pending architecture decision.