claude-gauge
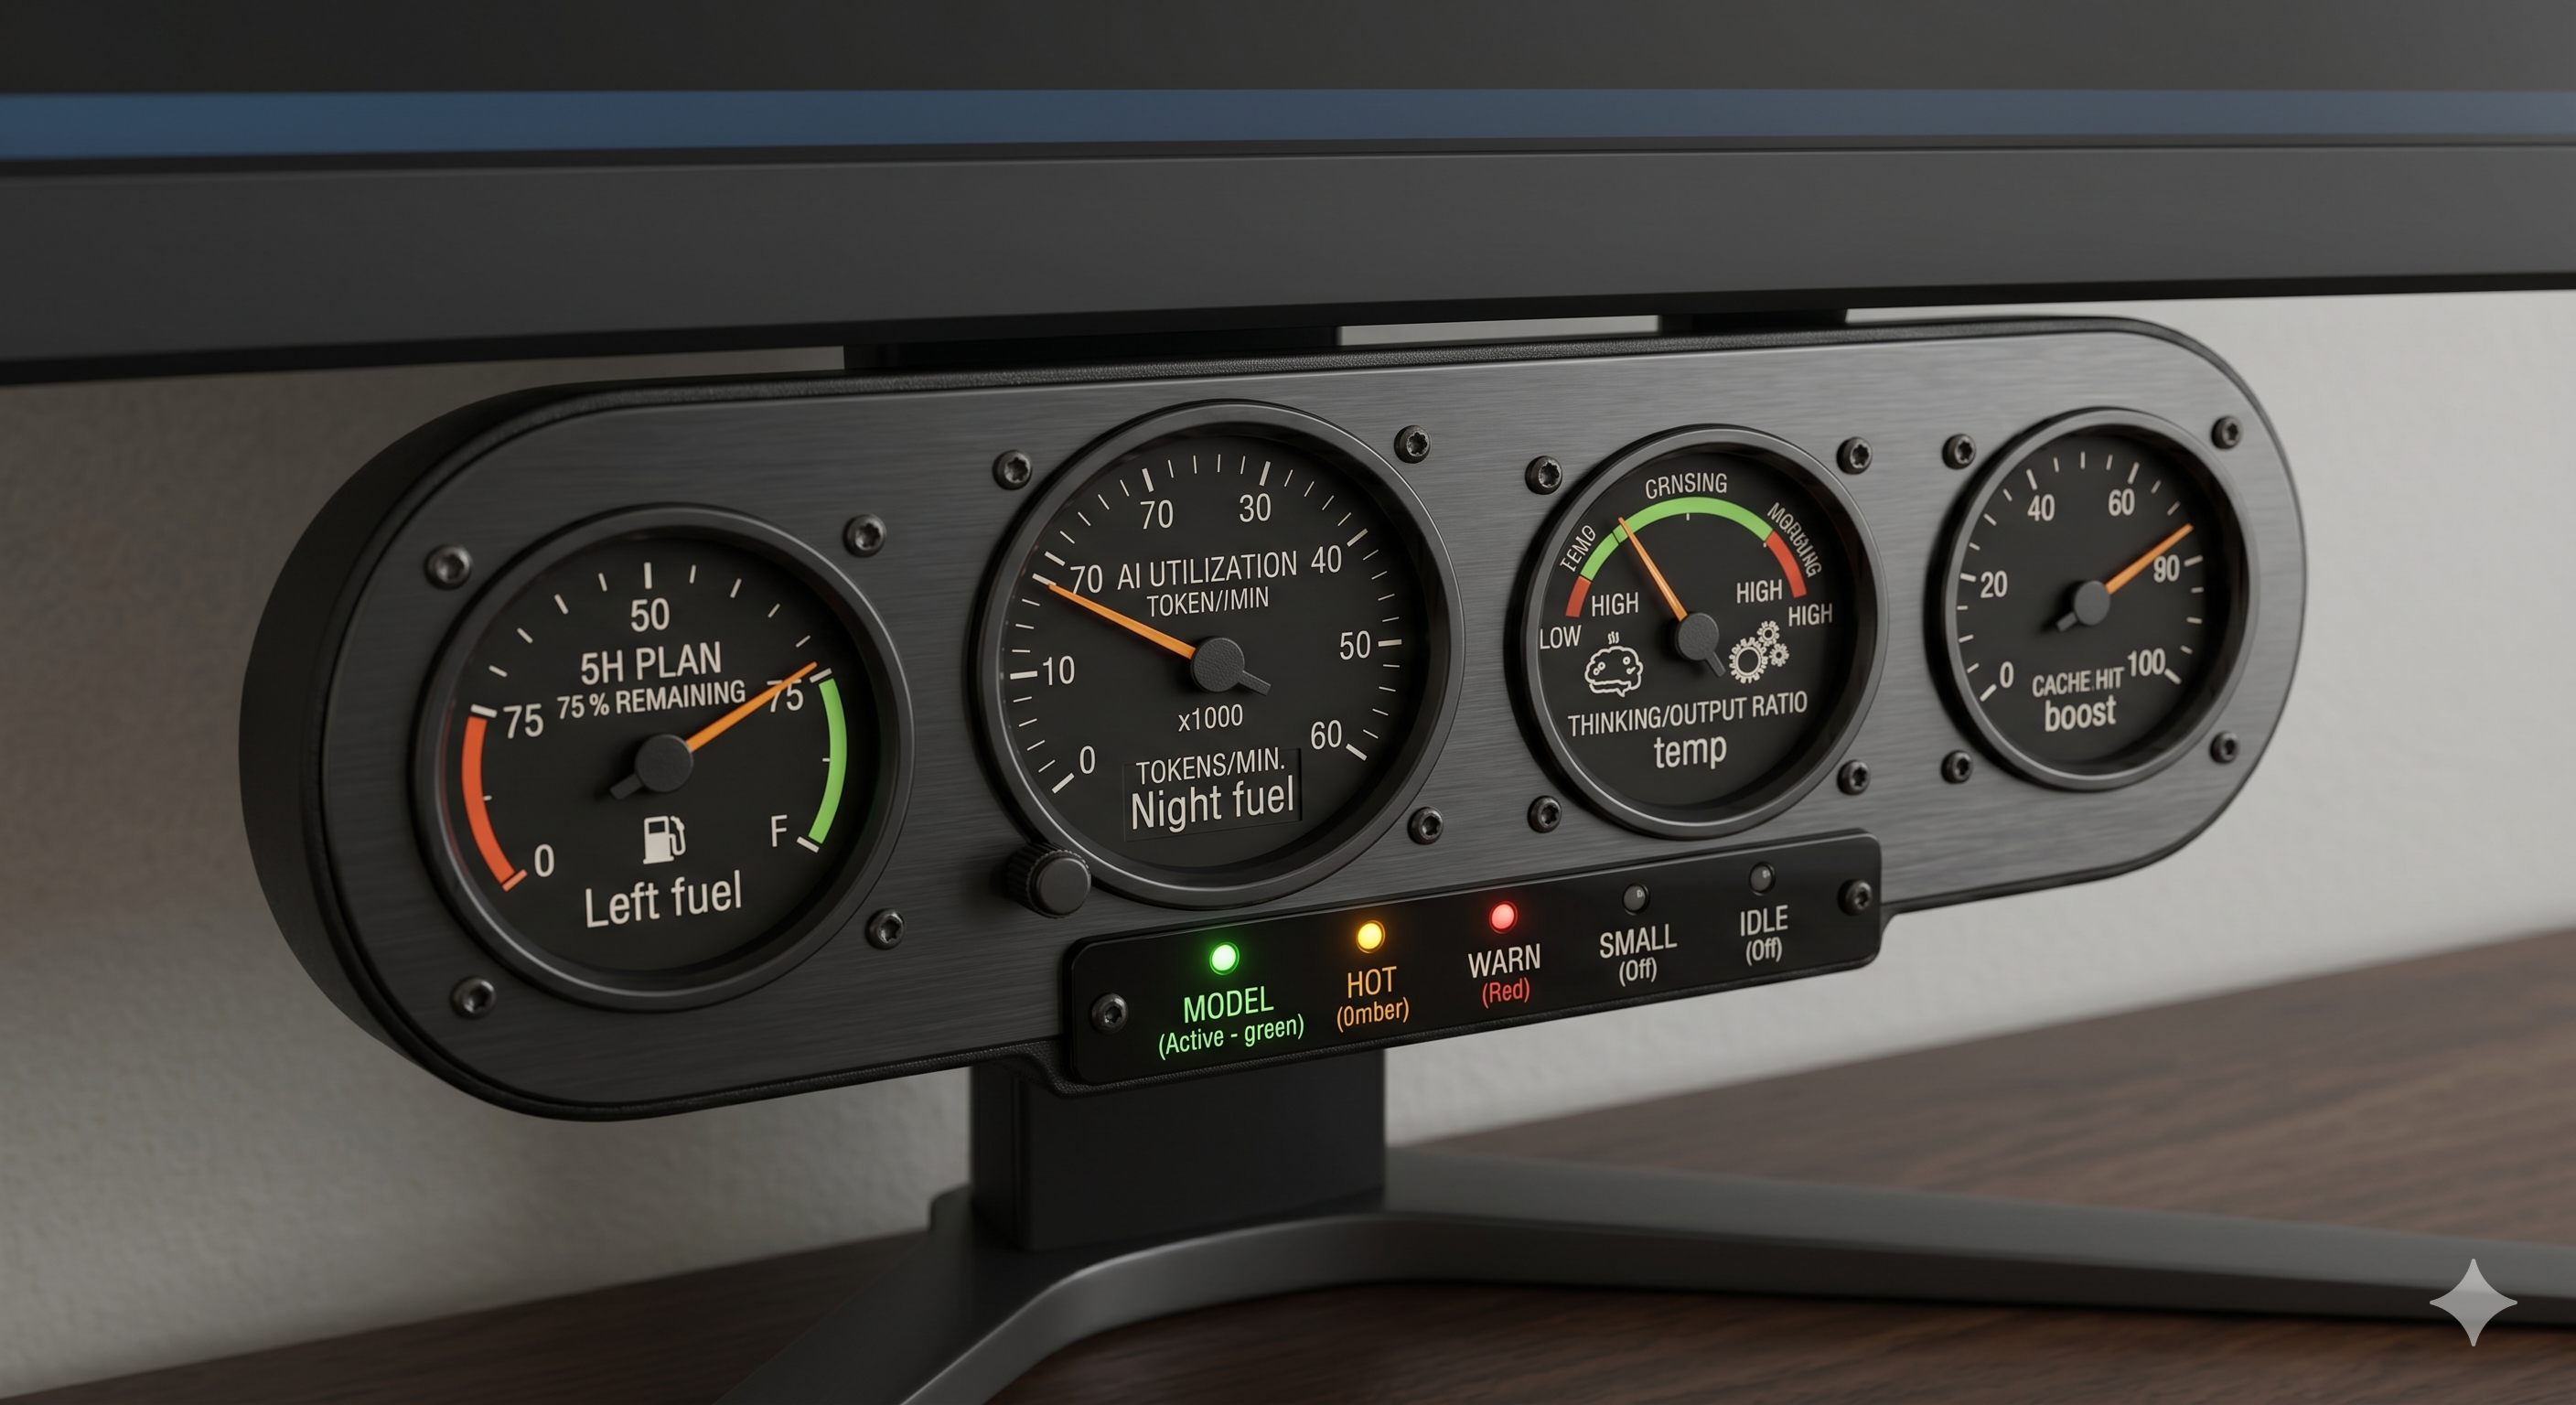
Hardware instrument cluster displaying Claude Code session telemetry
in real time. Four analog needle gauges plus an annunciator row,
driven by an ESP32 polling a local Python daemon. The daemon reads
either Claude Code's native OpenTelemetry feed through Prometheus
(architecture A) or ccusage CLI aggregates with a direct JSONL
tail for the tach (architecture B). Firmware and cluster are
identical across both.
Fighter-jet / race-car aesthetic. Physical-first. The deep stats
live in Grafana (A) or ccusage's own surfaces (B); the cluster is
the ambient summary.
Pages
- Architecture — two-architecture tradeoff, daemon shape, shared HTTP surface
- DataSources — Docker Compose + PromQL for A,
ccusageintegration for B, Claude Code env vars - Hardware — cluster layout, X27.168 steppers, ESP32 wiring, firmware structure, enclosure
- Ecosystem — prior-art survey, what to borrow, where claude-gauge uniquely contributes
- Roadmap — phases, shipped, deferred
- Ideas — exotic enclosure variants, unique-angle shortlist, metrics brainstorm
At a glance
Four round gauges in a brushed-aluminium bezel, mounted under the monitor. Each drives from one primary metric.
| Gauge | Metric | Scale |
|---|---|---|
| 5H PLAN / Left fuel | % of 5h plan window used | 0 - 100% |
| TOKENS/MIN / Tach | Short-window burn rate | 0 - redline (configurable) |
| THINKING/OUTPUT / Temp | Ratio of thinking to output tokens | low - high (colour-coded) |
| CACHE HIT / Boost | Cache read as fraction of input | 0 - 100% |
Annunciator row below: MODEL (RGB, colour-coded per model), HOT (tach above redline), WARN (fuel or cache anomaly), STALL (no telemetry for N minutes), IDLE (daemon reachable, no activity).
The 7-day window is deliberately absent from the physical cluster.
It moves too slowly to warrant a needle and lives on the deep-stats
dashboard (Grafana panel or ccusage TUI) instead.
Status
Scaffolded. Phase A pending architecture decision.
See the Roadmap for phase-by-phase plan.